

| Home | Downloads | About Us | Contact Us | |
| Crude Blog, Main Page |
| Sponsors |
 Ethiopian Airlines Africa's First 787 Arrives in 2008 |
| Wednesday 31 January 2007, March Contract, Daily Chart | |||||||||||
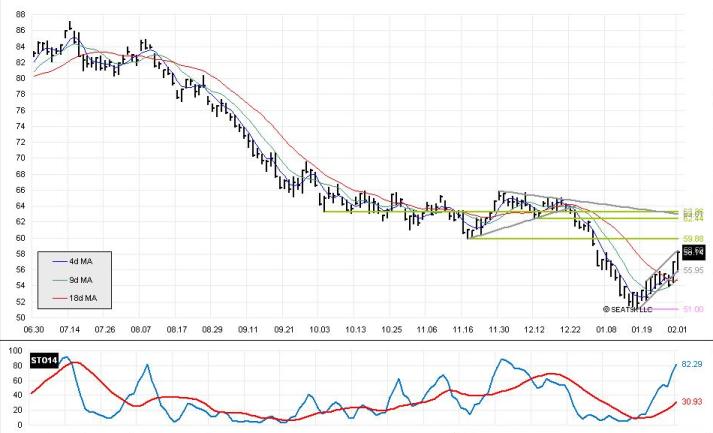 | |||||||||||
| Open | 56.35 |
High | 58.20 |
Low | 55.76 |
Close | 58.14 |
Change | +1.17 |
Percent | +2.1% |
|
Near-term Opinion: Neutral
Another big up day for the bulls, with prices ending the day while being confined to the trading range of the flag formation. There is a real threat that the recent gap in trading will be filled, and if prices move above 59.04 it will be bad news for the bears. We remain neutral. | |||||||||||
| Tuesday 30 January 2007, March Contract, Daily Chart | |||||||||||
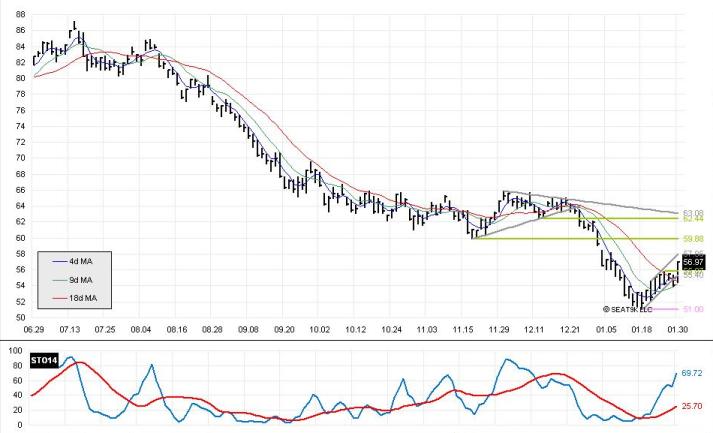 | |||||||||||
| Open | 54.55 |
High | 57.05 |
Low | 54.45 |
Close | 56.97 |
Change | +2.96 |
Percent | +5.5% |
|
Near-term Opinion: Neutral
A surprisingly strong day for the bulls on Tuesday, with prices up over 5% on the day. What looked like a pretty strong bet that prices would move lower fell apart completely with prices racing higher. We have given up our bearish tilt on the neutral rating, and are now solidly neutral. | |||||||||||
| Monday 29 January 2007, March Contract, Daily Chart | |||||||||||
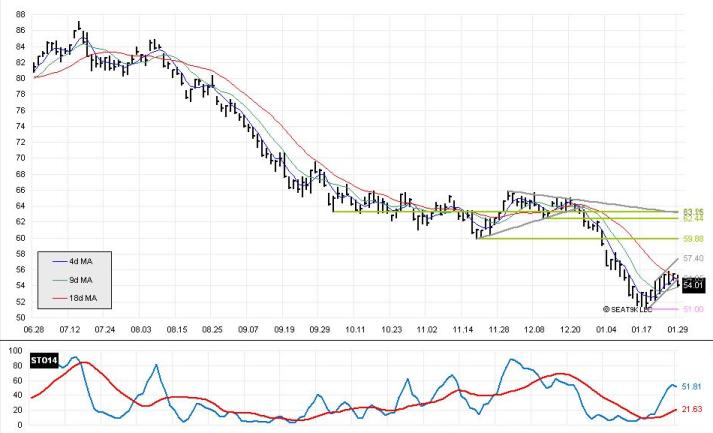 | |||||||||||
| Open | 54.95 |
High | 55.40 |
Low | 53.82 |
Close | 54.01 |
Change | -1.41 |
Percent | -2.5% |
|
Near-term Opinion: Neutral, leaning bearish
Prices moved out of the flag formation today, and with the significant recuperation of the stochastics we look for prices to gravitate to the recent low of 51.00. Although we remain neutral until the 51.00 support level fails, we would expect some bears to jump into the market at this stage to capitalize on potential short term gains to 51.00 | |||||||||||
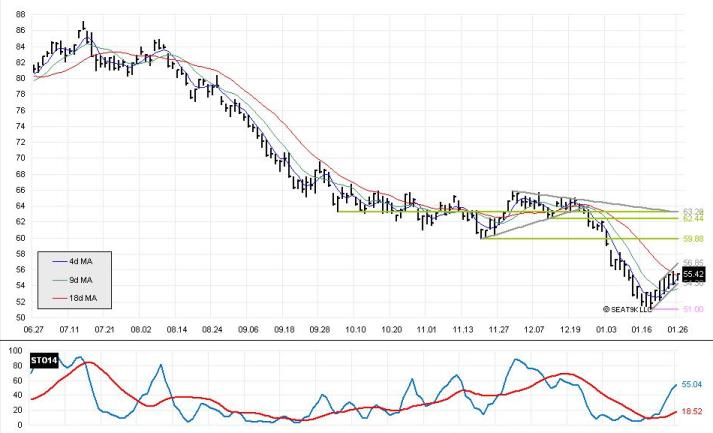
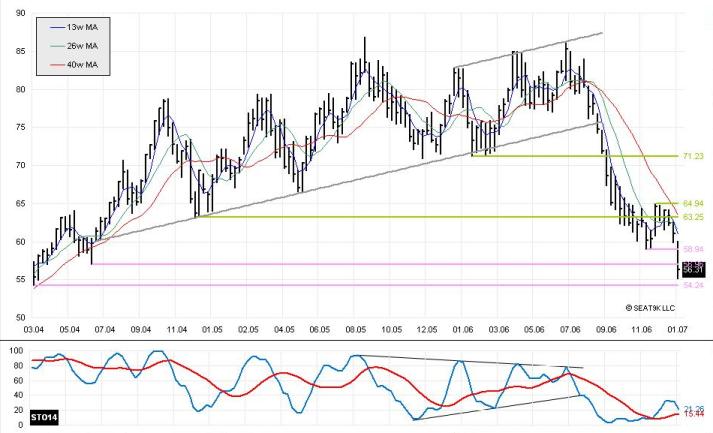
| Friday 26 January 2007, Weekly Chart | |||||||||||
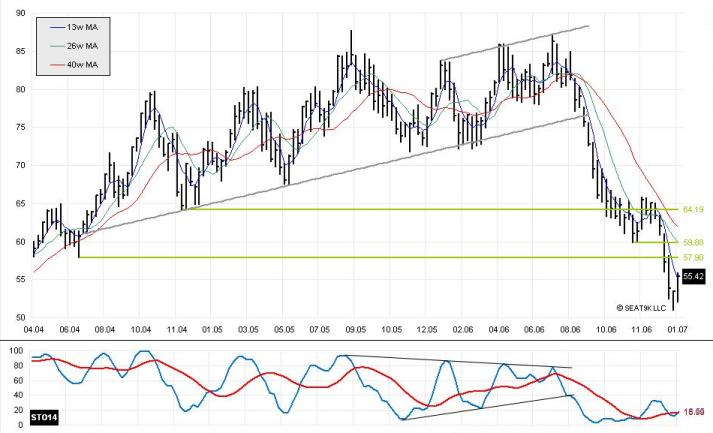 | |||||||||||
| Open | 53.75 |
High | 55.87 |
Low | 52.10 |
Close | 55.42 |
Change | +2.02 |
Percent | +3.8% |
|
Medium-term Opinion: Bearish
Crude rebounded higher this week after a string of lower closes. Trading ended the week just a hair above the 13-week moving average, which should be a point of concern for the bears. However, we are maintaining our bearish position until prices close above the 26-week moving average, which today ended at 59.99. | |||||||||||
| Friday 26 January 2007, March Contract, Daily Chart | |||||||||||
 | |||||||||||
| Open | 54.85 |
High | 55.52 |
Low | 55.42 |
Close | 55.50 |
Change | +1.19 |
Percent | +2.2% |
|
Near-term Opinion: Neutral, leaning bearish
An inside trading day for crude today, and the flag formation is holding. We are neutral, but leaning bearish based on the likelihood that prices will break on the down side and challenge the 51.00 support level sometime next week. | |||||||||||
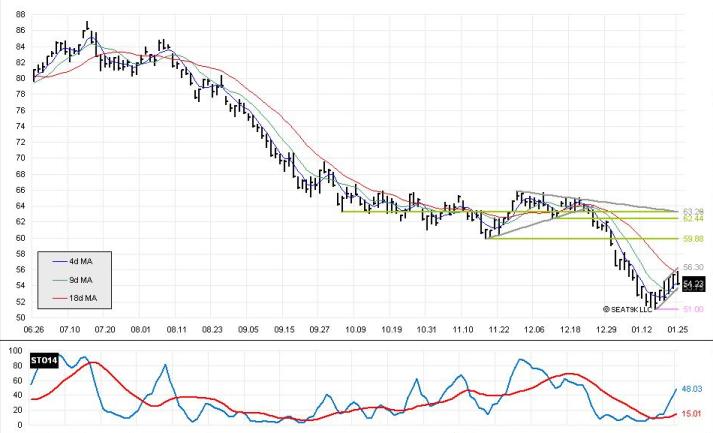
| Thursday 25 January 2007, March Contract, Daily Chart | |||||||||||
 | |||||||||||
| Open | 55.15 |
High | 55.87 |
Low | 54.11 |
Close | 54.23 |
Change | -1.14 |
Percent | -2.1% |
|
Near-term Opinion: Neutral, leaning bearish
Crude moved higher in the morning, setting a relative high, but fell in the afternoon and closed lower. With a higher high and lower close, we may have a reversal pattern on the chart, particularly with the close at the bottom of the day's trading range. On 23Jan we noted that aggressive bears may take the opportunity to jump into the market on a reversal pattern, and with today's reversal pattern that may come into play. On 24Jan we noted that there would be a lot of resistance with the 18-day moving average, and today saw a price failure at the 18-day moving average. This activity, plus the recovery of the stochastics, would lead us to believe that there is a strong likelihood that the flag formation may fail on Friday. We would expect prices to fall over the next few sessions, and that the 51.00 support level will be tested soon. | |||||||||||
| Wednesday 24 January 2007, March Contract, Daily Chart | |||||||||||
 | |||||||||||
| Open | 54.75 |
High | 55.45 |
Low | 53.70 |
Close | 55.37 |
Change | +0.33 |
Percent | +0.6% |
|
Near-term Opinion: Neutral, leaning bearish
Crude edged slightly higher today, up 33 cents. We have drawn a possible flag formation on the chart, and today's activity held within the range of this flag. Our opinion is leaning bearish because there are a number of indications that prices may drop lower. Crude will face a lot of pressure at the 18-day moving average, and if the bottom edge of the flag formation fails, look for the 51.00 support level to be tested. The stochastics are recovering, and a high enough value may allow a significant move lower if prices start to move south. | |||||||||||
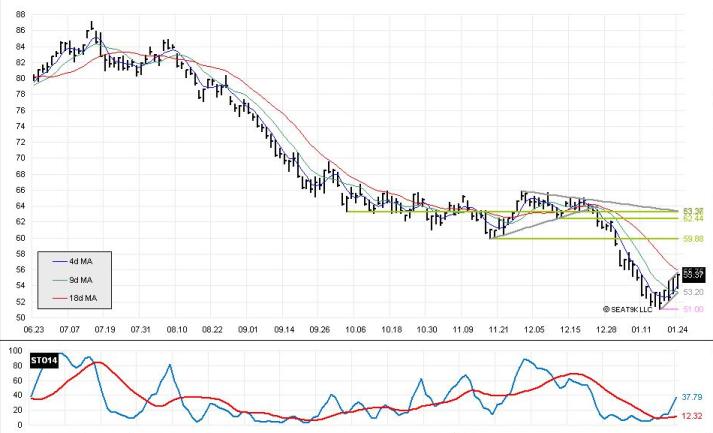
| Tuesday 23 January 2007, March Contract, Daily Chart | |||||||||||
 | |||||||||||
| Open | 53.40 |
High | 55.15 |
Low | 53.05 |
Close | 55.04 |
Change | +2.46 |
Percent | +4.7% |
|
Near-term Opinion Changed to Neutral
Crude moved solidly higher today, ignoring Monday's reversal day, and closed above the 9-day moving average. We are changing our opinion to neutral, and will hold off on entering the bearish side again until we reach a new low. However, aggressive bears may wish to consider entering the market on a reversal day assuming that a flag formation is being formed. | |||||||||||
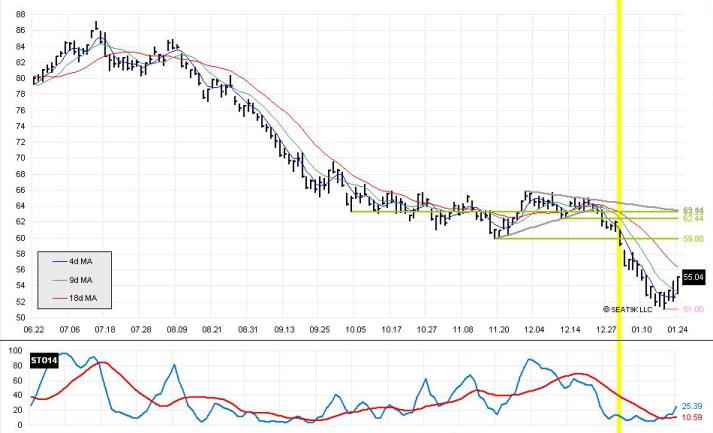
| Monday 22 January 2007, March Contract, Daily Chart | |||||||||||
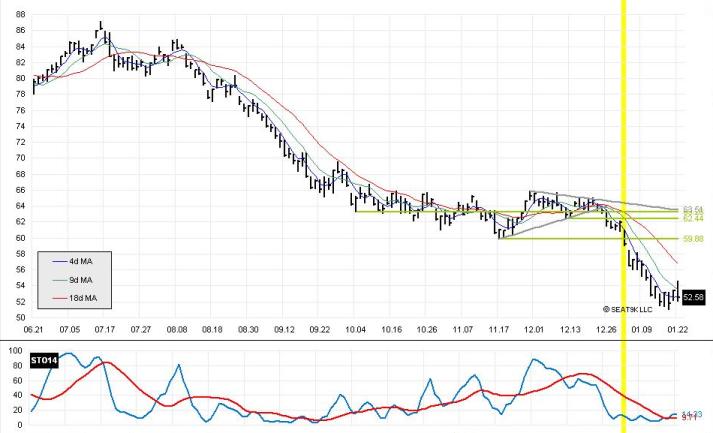 | |||||||||||
| Open | 53.75 |
High | 54.65 |
Low | 52.10 |
Close | 52.58 |
Change | -0.82 |
Percent | -1.5% |
|
Near-term Opinion: Bearish
Crude gapped higher on the opening and moved solidly above the 9-day moving average; had prices stayed at this level we would have abandoned our bearish point of view. However, the steam fell out of the bulls in the afternoon, and prices moved down for the rest of the session and closing down on the day. We consider this a very bearish indicator, and would expect that the bears would have added to their short positions based on today's activity. We remain bearish, and expect prices to move lower on Tuesday, perhaps testing the recent low of 51.00 reached on Thursday. | |||||||||||
| Friday 19 January 2007, Weekly Chart | |||||||||||
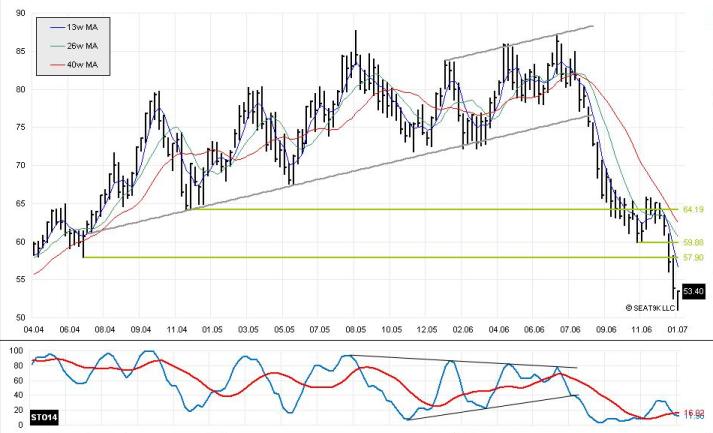 | |||||||||||
| Open | 52.95 |
High | 53.50 |
Low | 51.00 |
Close | 53.40 |
Change | -0.47 |
Percent | -0.9% |
|
Medium-term Opinion: Bearish
Crude moved lower this week, but recovered towards Friday to close down only slightly. There may be a bump in the works, or a period of consolidation, but until prices close above the 26-week moving average we are maintaining our bearish position. | |||||||||||
| Friday 19 January 2007, March Contract, Daily Chart | |||||||||||
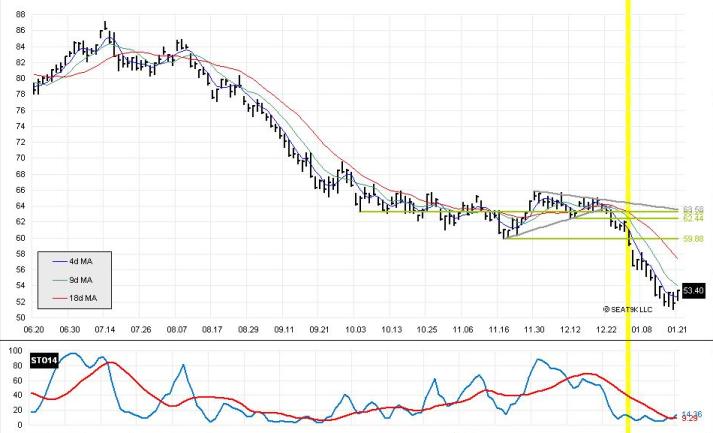 | |||||||||||
| Open | 52.25 |
High | 53.50 |
Low | 52.20 |
Close | 53.40 |
Change | +1.59 |
Percent | +3.1% |
|
Near-term Opinion: Bearish
Crude closed higher on Friday, and it appears that after the sharp move lower we are now in a period of consolidation. Until prices close above the 9-day moving average, we are retaining our bearish position. | |||||||||||
| Thursday 18 January 2007, March Contract, Daily Chart | |||||||||||
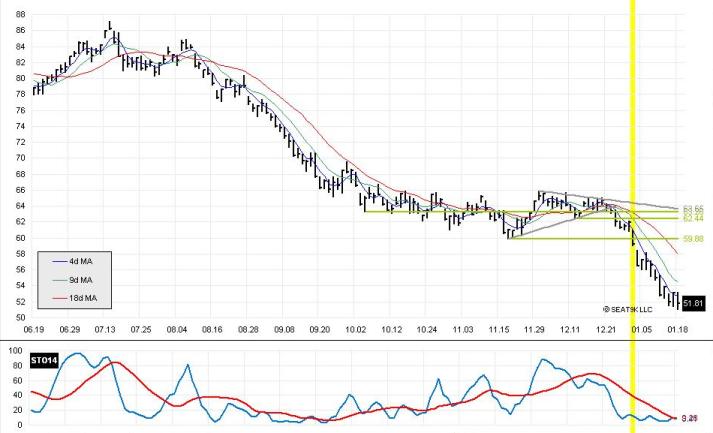 | |||||||||||
| Open | 53.20 |
High | 53.23 |
Low | 51.00 |
Close | 51.81 |
Change | -1.32 |
Percent | -2.5% |
|
Near-term Opinion: Bearish
The bulls were unable to capitalize on Wednesday's reversal day, and crude closed in a down reversal pattern on Thursday. Prices failed to stay above the 4-day moving average, and prices fell more than $1.30/bbl at the close of the day. Today's action confirms the declared downtrend, and we remain bearish. | |||||||||||
| Wednesday 17 January 2007, March Contract, Daily Chart | |||||||||||
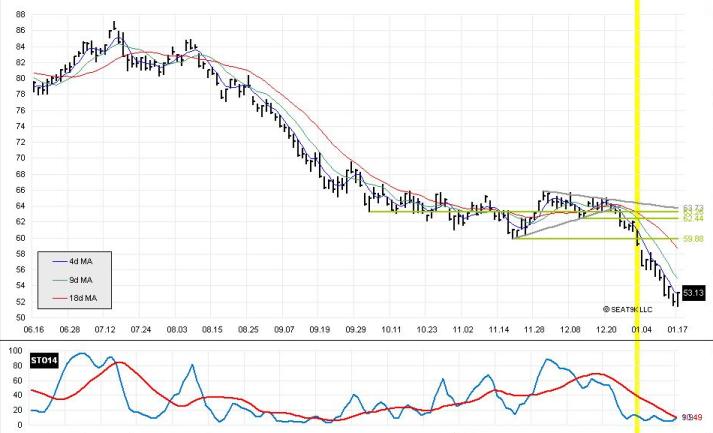 | |||||||||||
| Open | 51.65 |
High | 53.20 |
Low | 51.40 |
Close | 53.13 |
Change | +1.17 |
Percent | +2.3% |
|
Near-term Opinion: Bearish
Crude moved lower in the morning to reach another close, but moved higher in the afternoon and closed higher on the day. With a close at the top of the day's range and a near-cross of the stochastics we may have a bit of a bounce in trading. However, we believe the downtrend will hold, and will not abandon our bearish tilt until prices close above the 9-day moving average, which today finished at 54.91. | |||||||||||
| Tuesday 16 January 2007, March Contract, Daily Chart | |||||||||||
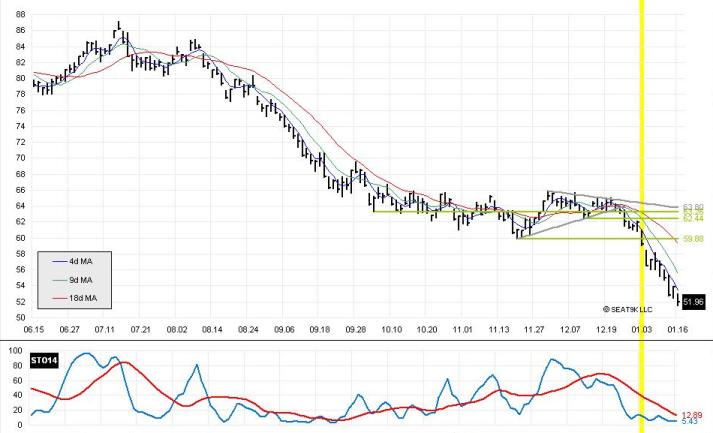 | |||||||||||
| Open | 52.95 |
High | 53.05 |
Low | 51.50 |
Close | 51.96 |
Change | -1.91 |
Percent | -3.5% |
|
Near-term Opinion: Bearish
The inability of the bulls to capitalize on the reversal day left on the chart on Friday is good news for the bears. Crude sank to new 18-month lows, and with the close near the bottom of the day's range there is no reason to abandon the short position now. We will maintain our bearish position until prices cross the 9-day moving average, which today ended at 55.59. | |||||||||||
| Friday 12 January 2007, Weekly Chart | |||||||||||
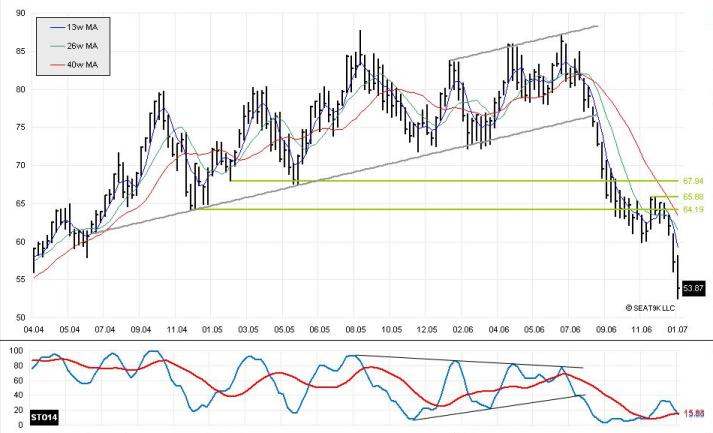 | |||||||||||
| Open | 57.99 |
High | 58.19 |
Low | 52.47 |
Close | 53.87 |
Change | -3.38 |
Percent | -5.9% |
|
Medium-term Opinion: Bearish
Crude again moved sharply lower this week, down over $3/bbl. In just three weeks crude fell almost $10/bbl, a dramatic move. The stochastics have crossed, and as they are not overly oversold, we do not see a reason to abandon our bearish opinion. We will remain bearish until prices cross the 26-week moving average, which ended the week at 61.50. | |||||||||||
| Friday 12 January 2007, March Contract, Daily Chart | |||||||||||
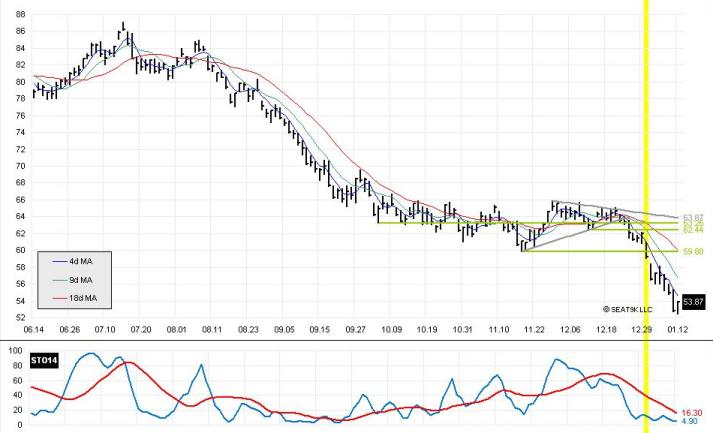 | |||||||||||
| Open | 53.20 |
High | 53.99 |
Low | 52.47 |
Close | 53.87 |
Change | +1.03 |
Percent | +1.9% |
|
Near-term Opinion: Bearish
After a string of down days and new lows, crude rebounded on Friday, ending the day up over $1/bbl. Today's pattern indicates a reversal day, with a new low followed by a higher close. With the day's close at the top of the range and the stochastics very oversold, we would not be surprised to see a day or two of higher closes. We do, however, remain bearish, and will maintain this opinion until prices close above the 9-day moving average, which today closed at 56.70. | |||||||||||
| Thursday 11 January 2007, March Contract, Daily Chart | |||||||||||
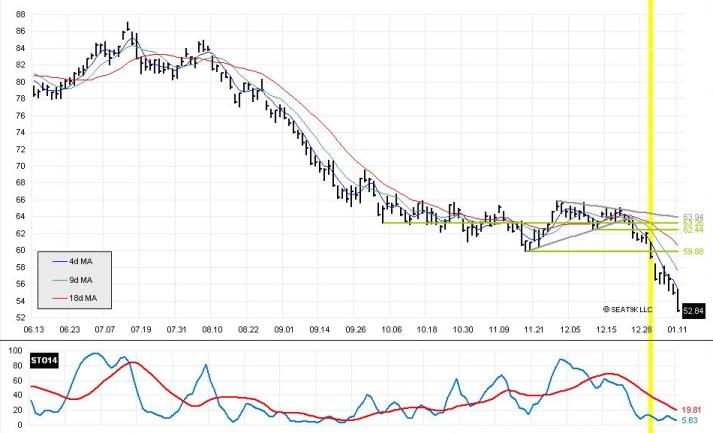 | |||||||||||
| Open | 54.80 |
High | 55.35 |
Low | 52.75 |
Close | 52.84 |
Change | -2.12 |
Percent | -3.9% |
|
We have switched to the March contract. Near-term Opinion: Bearish Another sharp drop for crude, with prices over $2/bbl, almost 4%. It looks as if the longs are headed towards the exits, and with today's close at the bottom of the range day we would not be surprised to see continued falling over the next session or two. Since declaring a bearish position only 8 days ago, prices are down over $6/bbl, or more than 10%. We remain bearish. | |||||||||||
| Wednesday 10 January 2007, February Contract, Daily Chart | |||||||||||
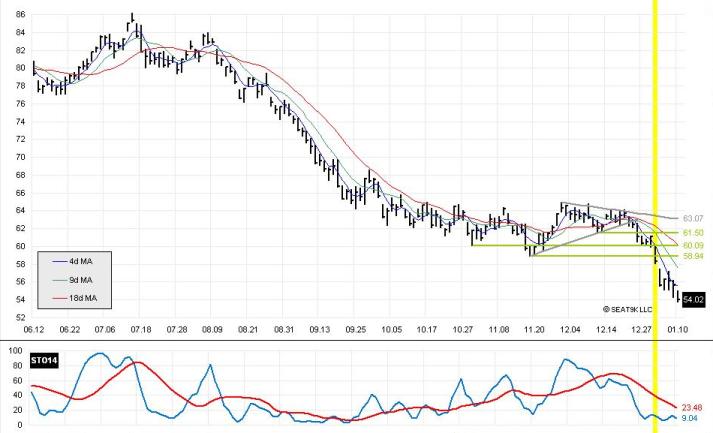 | |||||||||||
| Open | 55.00 |
High | 55.05 |
Low | 53.80 |
Close | 54.02 |
Change | -1.62 |
Percent | -2.9% |
|
Near-term Opinion: Bearish
Crude moved sharply lower again on Wednesday, down over $1.60/bbl, or almost 3%. Despite the oversold situation, there is little supporting prices, and continue to look for lower prices. Our opinion remains bearish. | |||||||||||
| Tuesday 09 January 2007, February Contract, Daily Chart | |||||||||||
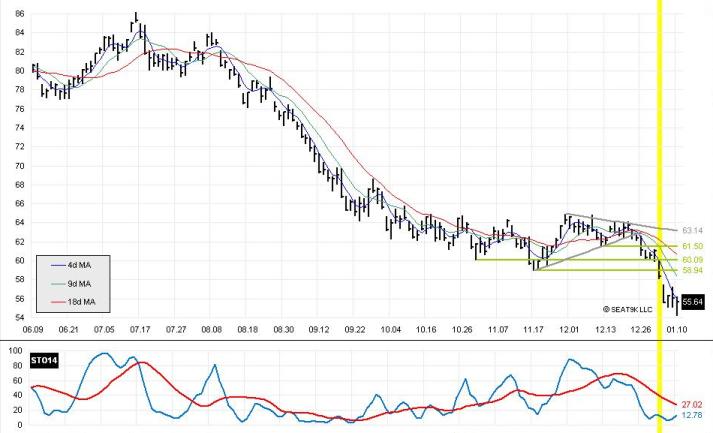 | |||||||||||
| Open | 54.75 |
High | 56.20 |
Low | 54.25 |
Close | 55.64 |
Change | -0.45 |
Percent | -0.8% |
|
Near-term Opinion: Bearish
Crude opened sharply lower on Tuesday, but recovered somewhat in the afternoon. The 4-day moving average appears to be keeping prices in check, although we consider the gap left on the chart to be a strong resistance level. We remain bearish. | |||||||||||
| Monday 08 January 2007, February Contract, Daily Chart | |||||||||||
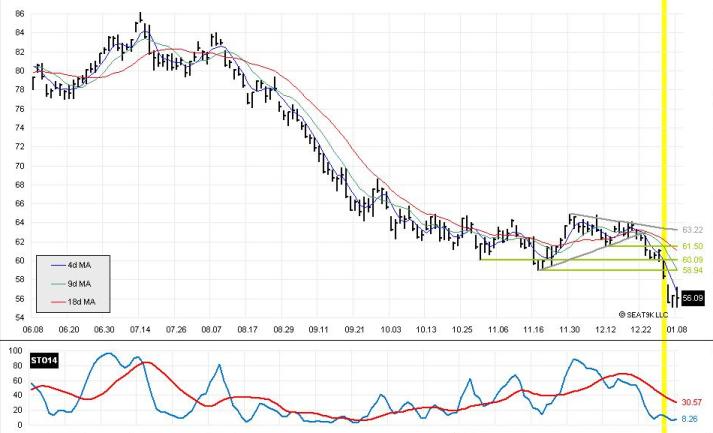 | |||||||||||
| Open | 57.05 |
High | 57.25 |
Low | 55.10 |
Close | 56.09 |
Change | -0.22 |
Percent | -0.4% |
|
Near-term Opinion: Bearish
Crude gapped open higher on the opening, but fell off later in the session and closed down slightly. This is encouraging for the bears, as the bulls were unable to capitalize on the oversold stochastics and the potential reversal pattern left on the chart Friday. We remain bearish. | |||||||||||
| Friday 05 January 2007, Weekly Chart | |||||||||||
 | |||||||||||
| Open | 60.05 |
High | 60.05 |
Low | 55.10 |
Close | 56.31 |
Change | -4.74 |
Percent | -7.8% |
|
Medium-term Opinion: Bearish
Crude prices fell sharply this week, dropping almost $5/bbl. With the movement below the recent low of 58.94, we have moved our opinion to bearish, and not that the stochastics have recovered enough to perhaps allow another wave down. | |||||||||||
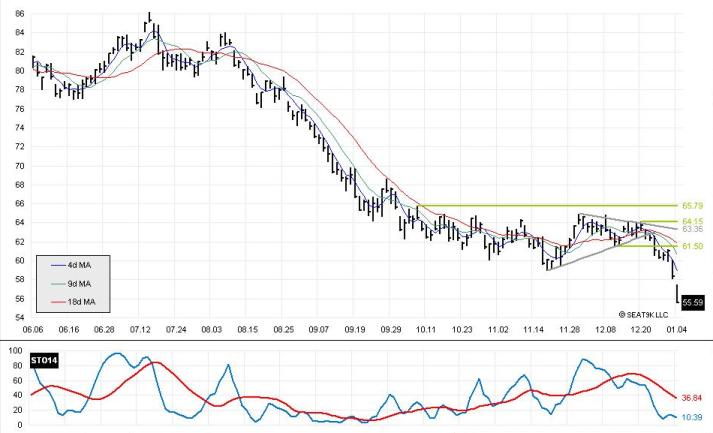
| Friday 05 January 2007, February Contract, Daily Chart | |||||||||||
 | |||||||||||
| Open | 55.75 |
High | 56.40 |
Low | 55.10 |
Close | 56.31 |
Change | +0.72 |
Percent | +1.3% |
|
Near-term Opinion: Bearish
Crude reached a new low, but recovered in the afternoon and closed up, near the day's high. With the oversold stochastics, we may have a reversal pattern, but the gap left on the chart should provide strong resistance. | |||||||||||
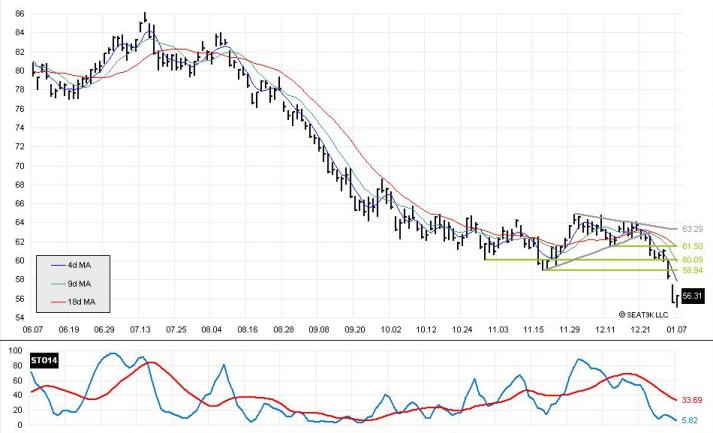
| Thursday 04 January 2007, February Contract, Daily Chart | |||||||||||
 | |||||||||||
| Open | 57.25 |
High | 57.50 |
Low | 55.55 |
Close | 55.59 |
Change | -2.73 |
Percent | -4.7% |
|
Near-term Opinion: Bearish
Crude gapped lower at the opening on Thursday, and fell throughout the day to close near the days low. Prices are down over $5/bbl in just two sessions, and today's activity could indicate a runaway gap. The situation confirms our change to a bearish opinion yesterday. | |||||||||||
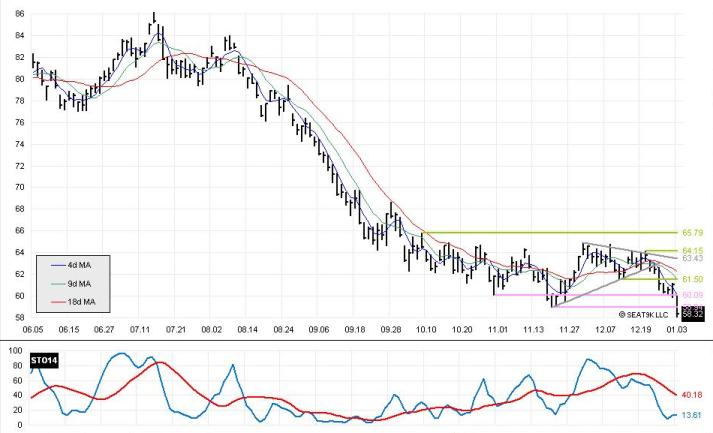
| Wednesday 03 January 2007, February Contract, Daily Chart | |||||||||||
 | |||||||||||
| Open | 60.05 |
High | 60.05 |
Low | 58.10 |
Close | 58.32 |
Change | -2.73 |
Percent | -4.5% |
|
Near-term Opinion Changed to Bearish
Crude moved sharply lower on Wednesday, falling below the recent support level of 58.94. With little support remaining on the chart, and with the stochastics with enough room to move lower, we have changed our position to bearish. We will maintain this position until we get two consecutive closes above the 58.94 support level, which now will become a resistance level. | |||||||||||