

| Home | Downloads | About Us | Contact Us | |
| Crude Blog, Main Page |
| Sponsors |
 Ethiopian Airlines Africa's First 787 Arrives in 2008 |
| Friday 29 September 2006, Weekly Chart | |||||||||||
 | |||||||||||
| Open | 60.05 |
High | 64.05 |
Low | 59.65 |
Close | 62.91 |
Change | +2.36 |
Percent | +3.9% |
|
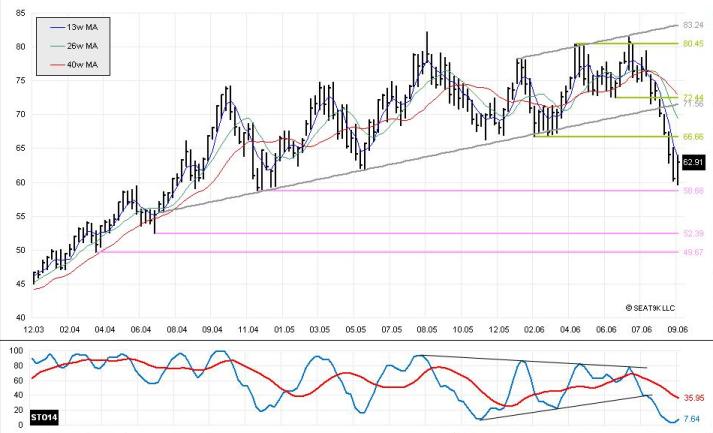
Medium-term Opinion: Bearish
The week ended with the first strong close in many weeks. Although prices settled below the 13-week moving average, the bulls can take some comfort in the potential reversal pattern, with a lower low and higher close. The recent drop in prices clearly stalled at the psychological support level of 60.00 and the fall 2004 low of 58.68. Our bearish position will remain in place until prices get above the 40-week moving average, which today finished at 72.97. | |||||||||||
| Friday 29 September 2006, November Contract, Daily Chart | |||||||||||
 | |||||||||||
| Open | 62.05 |
High | 63.10 |
Low | 61.45 |
Close | 62.91 |
Change | +0.15 |
Percent | +0.2% |
|
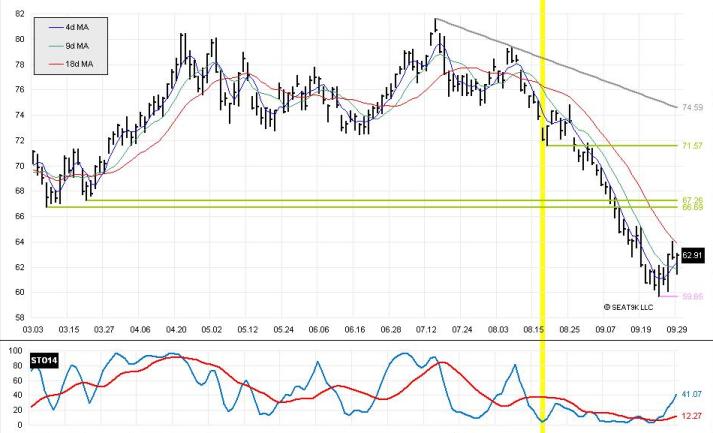
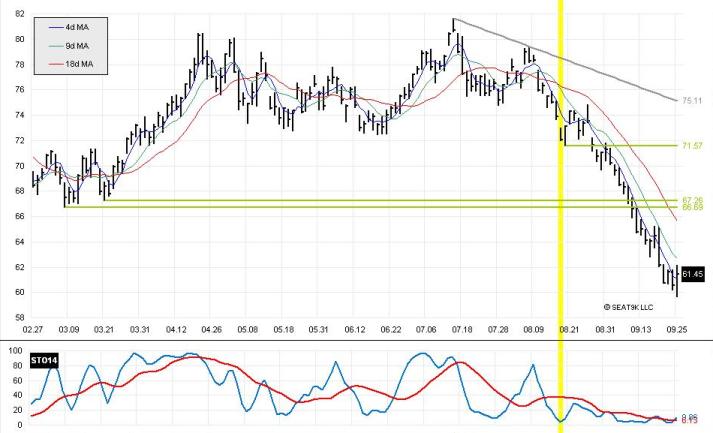
Near-term Opinion: Bearish
Prices appears to be consolidating, stuck between the moving averages and trying to figure out where to go. We continue to see the signs of what could be a flag formation on the chart, which would likely be followed by another ride down. However, it all depends on which level falls first, 59.65 or 64.05. Our opinion remains bearish until prices cross the 18-day moving average, which today finished at 63.84. | |||||||||||
| Thursday 28 September 2006, November Contract, Daily Chart | |||||||||||
 | |||||||||||
| Open | 62.95 |
High | 64.05 |
Low | 62.60 |
Close | 62.76 |
Change | -0.20 |
Percent | -0.3% |
|
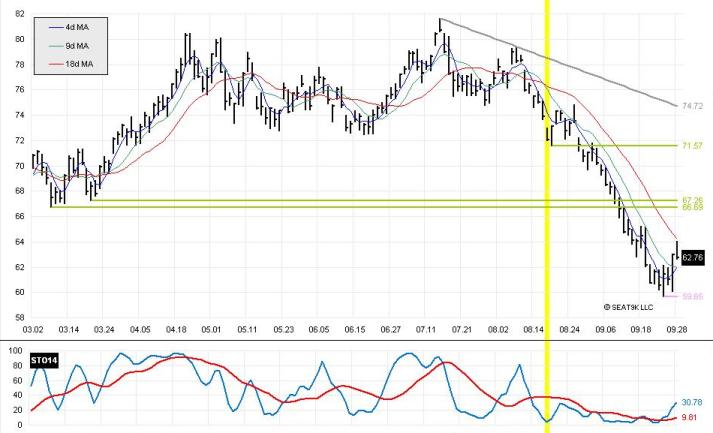
Near-term Opinion: Bearish
Today's chart activity could be significant. The bulls drove prices higher today, but trading ended the day down although marginally. However, what is left on the chart is an outside reversal day, with a higher high but a lower close than yesterday. This often results in 1-2 days worth of downside trading. However, because the failure on the high was just shy of the 18-day moving average, and because the close for the day was at the bottom of the day's range, and because the stochastics have recovered from their oversold levels, we would not be surprised for the recent low of 59.65 to fall next week. We would expect many traders that missed out on the recent downtrend to use today's activity to load up on short positions hoping that this week's activity was only a pause in a larger downtrend. If the 59.65 level falls before prices move higher than today's high, we would have an awkwardly formed flag formation, which could indicate that the "pole" of the flag would be replicated lower. If we say the pole started at 71.57, we have a pole length of about $12, and thus would target the move downward equal to another $12 pole, or down to abour $48/bbl, which would be a significant move. It all hinges on whether 64.05 or 59.65 falls first, and as charts more often stay in trends than switch out of them, we would not be surprised to see 59.65 fall first. Our opinion remains bearish until prices cross the 18-day moving average, which today finished at 64.22. | |||||||||||
| Wednesday 27 September 2006, November Contract, Daily Chart | |||||||||||
 | |||||||||||
| Open | 61.45 |
High | 63.05 |
Low | 60.10 |
Close | 62.96 |
Change | +1.95 |
Percent | +3.2% |
|
Near-term Opinion: Bearish
The bulls showed some signs of life on Wednesday, with a big up day. Trading closed up almost $2/bbl, and closed above the 9-day moving average for the first time in weeks. The $60/bbl support level is showing its strength. A this juncture, we are either at a pause in a larger downtrend, or the recent downtrend is over, to be followed by either an uptrend or stabilization. If prices can get above the 18-day moving average for two consecutive closes we would likely declare the downtrend over. However, once a trend gets going it is hard to stop (as witnessed by the recent uptrend). If prices get below Monday's low of 59.65, look for prices to sink further still based on the recovery of the stochastics. This would likely result in a flag formation and would likely be bad news for the bulls. Our opinion remains bearish until prices cross the 18-day moving average, which today finished at 64.63. | |||||||||||
| Tuesday 26 September 2006, November Contract, Daily Chart | |||||||||||
 | |||||||||||
| Open | 61.05 |
High | 62.00 |
Low | 60.60 |
Close | 61.01 |
Change | -0.44 |
Percent | -0.7% |
|
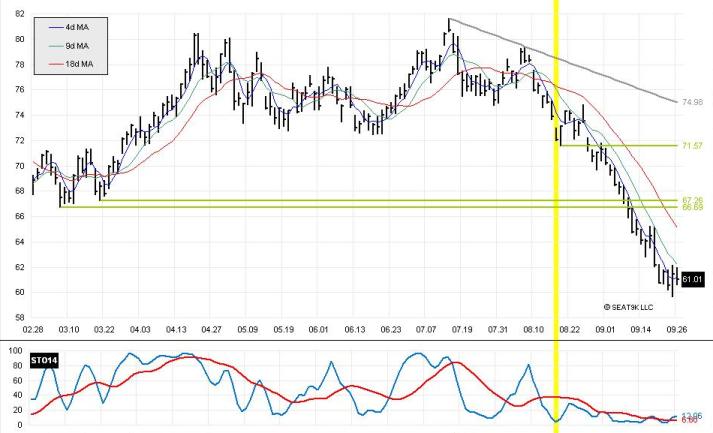
Near-term Opinion: Bearish
Tuesday we ended up with an inside trading day, with a range within the limits of yesterday's high and low. Regardless of the close, the inability to generate a higher high after yesterday's reversal day does not bode well for the bulls, and prices closed back down below the 4-day moving average. We would not be surprised to see the 60.00 level fall later this week based on the feeble showing by the bulls today. Our opinion remains bearish until prices cross the 18-day moving average, which today finished at 65.09. | |||||||||||
| Monday 25 September 2006, November Contract, Daily Chart | |||||||||||
 | |||||||||||
| Open | 60.05 |
High | 62.15 |
Low | 59.65 |
Close | 61.45 |
Change | +0.90 |
Percent | +1.5% |
|
Near-term Opinion: Bearish
Trading moved below the critical $60/bbl level for a brief moment today before recovering in the afternoon. With a lower low and a higher close, we have a potential reversal day, and we can expect to see one or two days' worth of upside movement. The stochastics again have crossed, and the bulls may be able to squeeze a bounce out of today's activity. We did have a close above the 4-day moving average today. Our opinion remains bearish until prices cross the 18-day moving average, which today finished at 65.65. | |||||||||||
| Friday 22 September 2006, Weekly Chart | |||||||||||
 | |||||||||||
| Open | 64.30 |
High | 65.20 |
Low | 60.20 |
Close | 60.55 |
Change | -3.47 |
Percent | -5.4% |
|
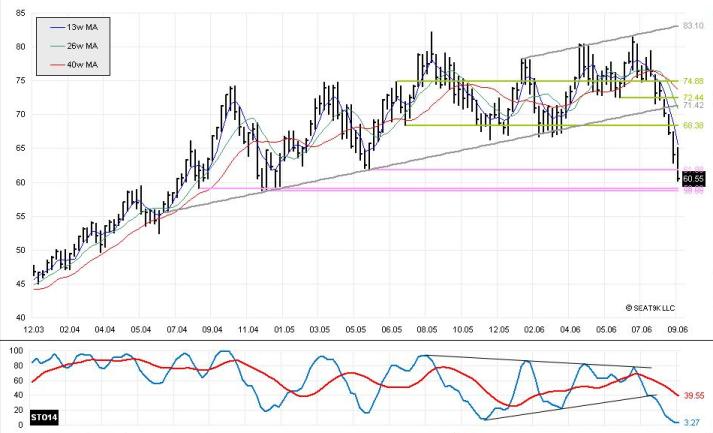
Medium-term Opinion: Bearish
Another sharp drop in crude prices for the week, with prices closing near the bottom of the week's range. After such a plunge in prices, and with the important psychological support level of 60.00 just out of reach, we would not be surprised to see a pause in the free-fall. Our bearish position will remain in place until prices get above the 40-week moving average, which today finished at 73.69. | |||||||||||
| Friday 22 September 2006, November Contract, Daily Chart | |||||||||||
 | |||||||||||
| Open | 61.75 |
High | 61.80 |
Low | 60.20 |
Close | 60.55 |
Change | -1.04 |
Percent | -1.7% |
|
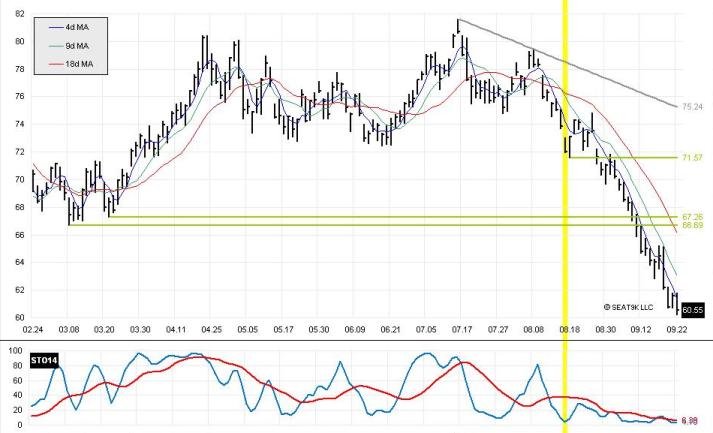
Near-term Opinion: Bearish
The expected stabilization of trading again did not materialize, and again we have a new low on the chart. Despite the oversold stochastics, there is little holding up prices other than the psychological support level of 60/bbl. Our opinion remains bearish until prices cross the 18-day moving average, which today finished at 66.16. | |||||||||||
| Thursday 21 September 2006, November Contract, Daily Chart | |||||||||||
 | |||||||||||
| Open | 60.85 |
High | 61.80 |
Low | 60.69 |
Close | 61.59 |
Change | +0.85 |
Percent | +1.4% |
|
Near-term Opinion: Bearish
After two big drops down, prices stabilized on Thursday and managed to close 85 cents higher. Although it appears to be an inside trading day, today's low was one penny lower than yesterday's low, and we technically have an outside reversal day on the chart. With the close near the top of the day's range, we may see another move higher tomorrow. However, any attempts to even slow the down-draft down has been thwarted by the bears recently. Our opinion remains bearish until prices cross the 18-day moving average, which today finished at 66.78. | |||||||||||
| Wednesday 20 September 2006, November Contract, Daily Chart | |||||||||||
 | |||||||||||
| Open | 61.70 |
High | 62.20 |
Low | 60.70 |
Close | 62.20 |
Change | -1.43 |
Percent | -2.3% |
|
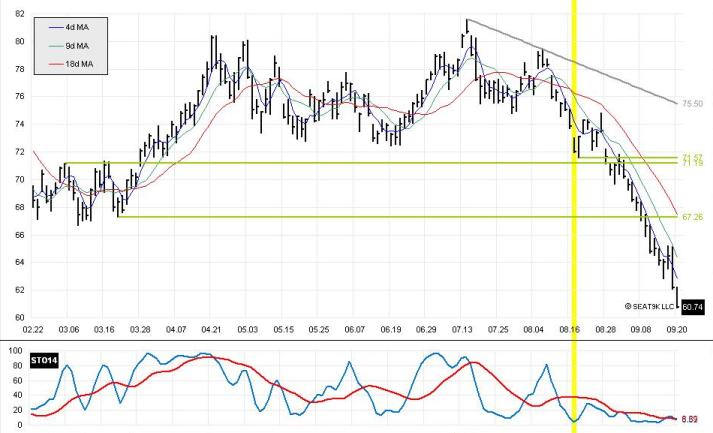
Near-term Opinion: Bearish
Prices sank again sharply today, and with prices closing at the bottom of the day's range it is likely that the bears will continue to press prices lower. We are, however, approaching the psychological support level of 60.00/bbl, which may halt the recent slide in prices. Our opinion remains bearish, however, until prices cross the 18-day moving average, which today finished at 67.44. | |||||||||||
| Tuesday 19 September 2006, November Contract, Daily Chart | |||||||||||
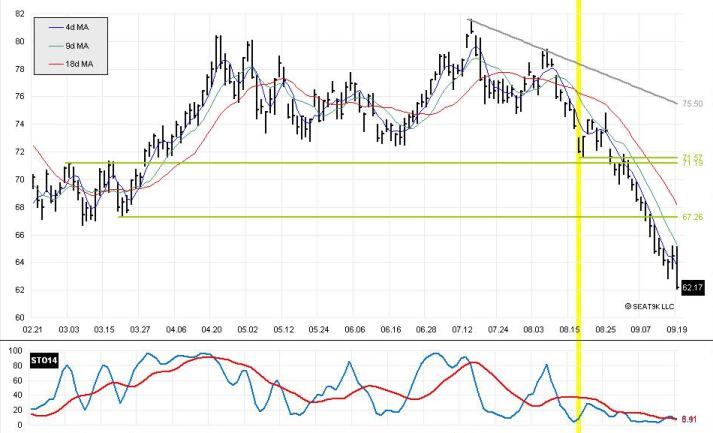 | |||||||||||
| Open | 64.70 |
High | 65.15 |
Low | 62.05 |
Close | 62.17 |
Change | -2.28 |
Percent | -3.5% |
|
Near-term Opinion: Bearish
Our period of price consolidation was brief indeed, with prices stabilizing and then dropping sharply lower. Despite the oversold stochastics, the close at a new low on the chart is significant, and with prices ending at the bottom of the range the bears are firmly in control. Our opinion remains bearish until prices cross the 18-day moving average, which today finished at 68.14. | |||||||||||
| Monday 18 September 2006, November Contract, Daily Chart | |||||||||||
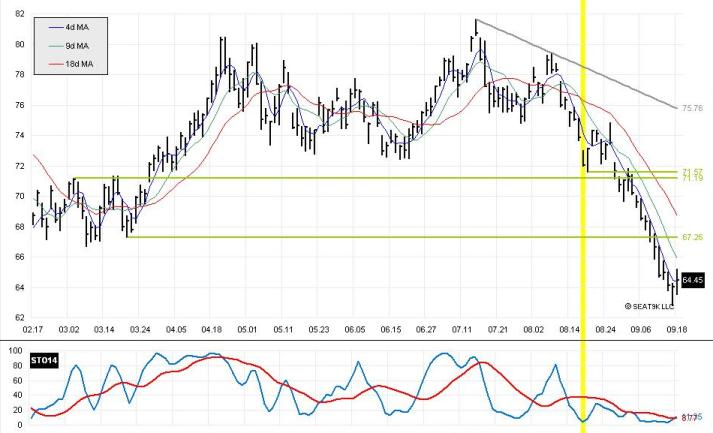 | |||||||||||
| Open | 64.30 |
High | 65.20 |
Low | 63.51 |
Close | 64.45 |
Change | +0.43 |
Percent | +0.7% |
|
Near-term Opinion: Bearish
Trading closed slightly higher today, but there are some signs that the tremendous drop in prices will at the very least take a little breather. Today we had a higher high and higher low, something that has not happened since 30 August. Moreover, crude closed about the 4-day moving average and the stochastics have now crossed at very low levels. Given these events, plus the relatively proximity of the 61.88 support level on the weekly chart, we would expect prices to either bounce higher or move sideways for a few sessions before turning south yet again. Our opinion remains bearish until prices cross the 18-day moving average, which today finished at 68.73. | |||||||||||
| Friday 15 September 2006, Weekly Chart | |||||||||||
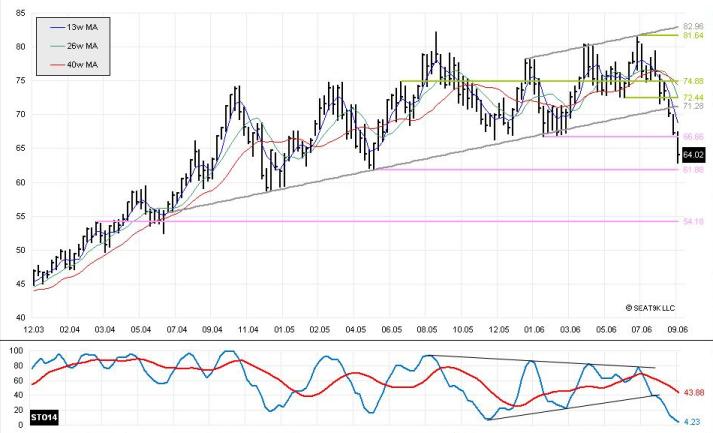 | |||||||||||
| Open | 66.31 |
High | 67.51 |
Low | 62.80 |
Close | 64.02 |
Change | -3.24 |
Percent | -4.8% |
|
Medium-term Opinion: Bearish
Another sharp drop in crude prices for the week, with the move out of the trend channel clearly shown on the chart. Traders did not even pause at the support level of 66.66. Prices are down over $17/bbl in just ten weeks. With the stochastics still very oversold, we would not be surprised to see the down-draft stop at the next support level, which is at 61.88. Our bearish position will remain in place until prices get above the 40-week moving average, which today finished at 74.41. | |||||||||||
| Friday 15 September 2006, November Contract, Daily Chart | |||||||||||
 | |||||||||||
| Open | 63.75 |
High | 64.25 |
Low | 62.80 |
Close | 64.02 |
Change | -0.09 |
Percent | -0.1% |
|
Near-term Opinion: Bearish
Prices closed down slightly today, but the big recovery could be significant. With trading closing at the top of the day's range, and with the stochastics heavily oversold after a sharp drop in prices we would not be surprised to see a pause or bounce at this point, despite the lack of support on the day chart. Our opinion remains bearish until prices cross the 18-day moving average, which today finished at 69.27. | |||||||||||
| Thursday 14 September 2006, November Contract, Daily Chart | |||||||||||
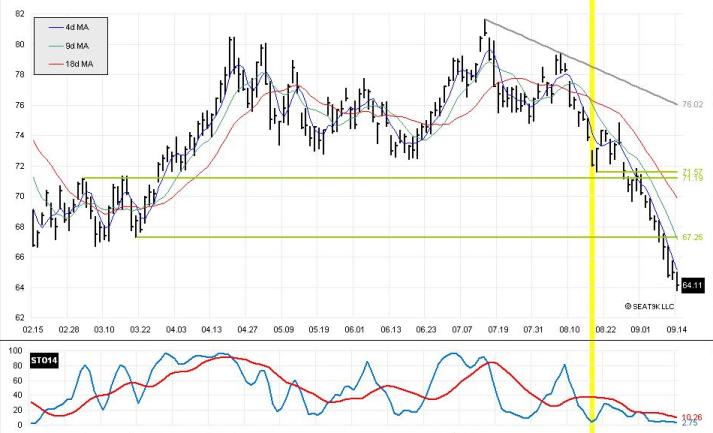 | |||||||||||
| Open | 64.85 |
High | 65.00 |
Low | 63.80 |
Close | 64.11 |
Change | -0.87 |
Percent | -1.3% |
|
Near-term Opinion: Bearish
We have switched to the November contract. The consolidation of trading was short lived, and Thursday the bears drove prices lower once again. The bears continue to be in command of the market, and despite the recent string of falling prices there is little support for the bulls to build upon to stop the down-draft. There are no support levels on the daily contract, but the weekly chart (to be published on Friday) shows a support level at 61.88, another $2.30 lower than where we are now. Our opinion will remain bearish until prices cross the 18-day moving average, which today finished at 69.84. We have indicated in yellow the date we changed from Neutral to Bearish. | |||||||||||
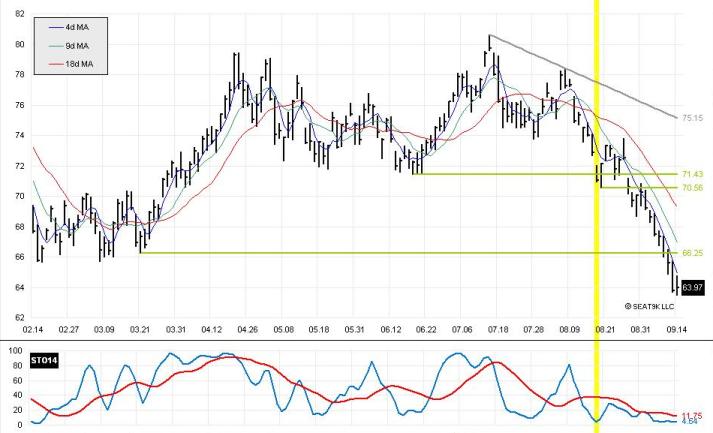
| Wednesday 13 September 2006, October Contract, Daily Chart | |||||||||||
 | |||||||||||
| Open | 64.20 |
High | 64.75 |
Low | 63.50 |
Close | 63.97 |
Change | +0.21 |
Percent | +0.3% |
|
Near-term Opinion: Bearish
The first close higher for crude in six sessions, today saw some consolidation in pricing. Atlhough the day's trading ended with a lower high and lower low, prcies ended higher, although still in the bottom half of the day's trading range. With stochastics heavily oversold after a sharp drop in prices we would not be surprised to see some consolidation, although a bounce at this point would not be likely. Our opinion will remain bearish until prices cross the 18-day moving average, which today finished at 69.33. We have indicated in yellow the date we changed from Neutral to Bearish. | |||||||||||
| I'll be overseas 13Sep-25Sep, so my postings may be slow in coming over this period | |||||||||||
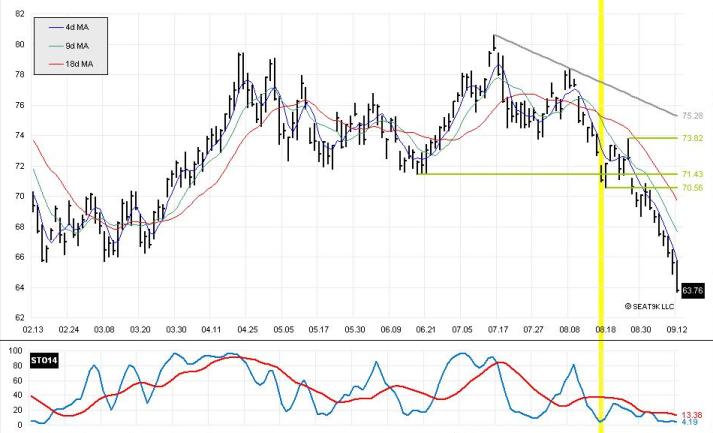
| Tuesday 12 September 2006, October Contract, Daily Chart | |||||||||||
 | |||||||||||
| Open | 65.50 |
High | 65.75 |
Low | 63.75 |
Close | 63.76 |
Change | -1.85 |
Percent | -2.8% |
|
Near-term Opinion: Bearish
The downdraft in crude prices continues, and there appears little support that the bulls can provide at this point. Today's session ended with the seventh consecutive lower close, and we see little support before 60.87, the low from May 2005 and near the next psychological support level of 60.00. In only two months prices have sunk an astonishing $16 per barrel. With today's activity closing at the bottom of the day's range and firmly below the last support level of 65.65, we see little reason for prices to rebound, and we maintain our target level of $50/bbl based on the activity on the weekly chart. Our opinion will remain bearish until prices cross the 18-day moving average, which today finished at 69.72. We have indicated in yellow the date we changed from Neutral to Bearish. | |||||||||||
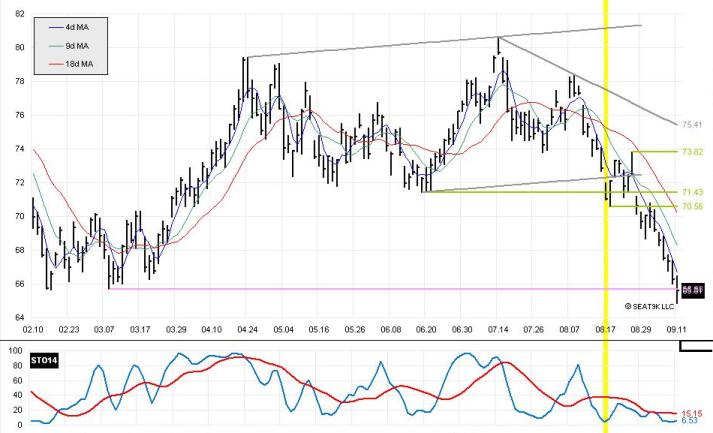
| Monday 11 September 2006, October Contract, Daily Chart | |||||||||||
 | |||||||||||
| Open | 65.30 |
High | 66.50 |
Low | 64.85 |
Close | 65.61 |
Change | -0.64 |
Percent | -1.0% |
|
Near-term Opinion: Bearish
Another down day for crude, and the bears continue to push prices lower. However, prices did recover after opening sharply lower. With the day's close almost exactly at the strong support level of 65.68 and the oversold stochastics, we would not be surprised to see some price consolidation, or perhaps even a bounce higher. If, however, the bears can propell trading lower than this support level, we would expect prices to move significantly lower. Our opinion will remain bearish until prices cross the 18-day moving average, which today finished at 70.23. We have indicated in yellow the date we changed from Neutral to Bearish. | |||||||||||
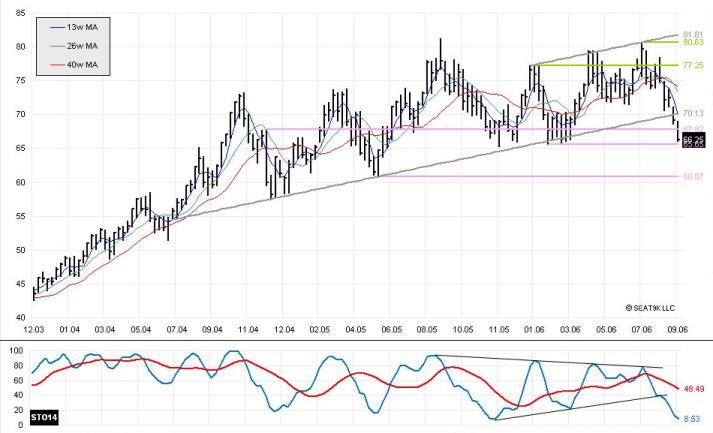
| Friday 08 September 2006, Weekly Chart | |||||||||||
 | |||||||||||
| Open | 68.80 |
High | 69.05 |
Low | 66.00 |
Close | 66.25 |
Change | -2.94 |
Percent | -4.3% |
|
Medium-term Opinion: Bearish
Prices fell again this week, moving sharply below the upward trend line that has been in place for over two years. The downside stochastic breakout and change to a bearish position on 18 August has been confirmed. At this point, however, there is very strong support at 65.65, and with stochastics very oversold we would not be surprised to see some consolidation over the next few weeks. If 65.65 falls, we would have an oddly shaped double-top formation, which would target prices down to about $50/bbl. Our bearish position will remain in place until prices get above the 40-week moving average, which today finished at 74.13. | |||||||||||
| Friday 08 September 2006, October Contract, Daily Chart | |||||||||||
 | |||||||||||
| Open | 67.30 |
High | 67.40 |
Low | 66.00 |
Close | 66.25 |
Change | -1.07 |
Percent | -1.6% |
|
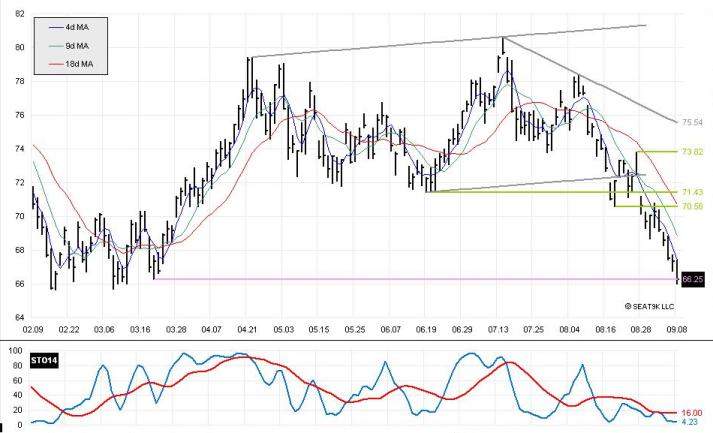
Near-term Opinion: Bearish
Prices fell another dollar today as the recent downtrend continues. However, prices settled exactly at our support level of 66.25. As mentioned in yesterday's report, we are at a critical juncture in trading, and there is likely to be significant stakes places by both the bears and the bulls. A combination of strong support and the oversold stochastics could result in a bounce higher, which could either signal the beginning of a sideways trend between 66.25 and 71.43 or the start of a new uptrend. However, there could also be some consolidation over the next few days, followed by another wave down. If the 65.65 support level fell, we would have a very big double-top formation, and the downside target would be estimated at about $50/bbl. Our opinion, however, will remain bearish until prices cross the 18-day moving average, which today finished at 70.69. | |||||||||||
| Thursday 07 September 2006, October Contract, Daily Chart | |||||||||||
 | |||||||||||
| Open | 67.50 |
High | 67.72 |
Low | 66.76 |
Close | 67.32 |
Change | -0.18 |
Percent | -0.3% |
|
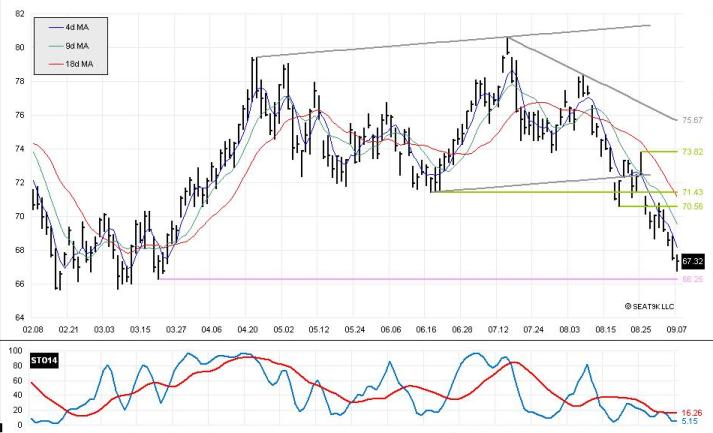
Near-term Opinion: Bearish
Crude closed down slightly on Thursday, a continuation of the recent downtrend. However, we see signs that the downward pressure of prices will see significant support around today's lows. The stochastics are very oversold, and with the sharp drop in prices over the past few weeks we would not be surprised for the bears to take some profits, which would likely lead to an uptick in prices. Moreover, the 65.65-66.25 support level is significant, as prices have not sunk below this level since May 2005. Finally, with today's close in the top half of the day's trading range, we would expect the recent sharp fall in prices to take a breather. Should prices bounce higher on Friday, there would be a lot of questions left on the chart at to the future direction of prices. At this juncture, the 71.43 level would be seen as an important resistance level. Prices could stay within the trading range of 66-72 and move sideways. If prices were to move above this range, we would change our opinion to bullish, while below this range we would consider the trend bearish. That being said, our opinion will remain bearish until prices cross the 18-day moving average, which today finished at 71.15. | |||||||||||
| Wednesday 06 September 2006, October Contract, Daily Chart | |||||||||||
 | |||||||||||
| Open | 68.65 |
High | 68.84 |
Low | 67.40 |
Close | 67.50 |
Change | -1.10 |
Percent | -1.6% |
|
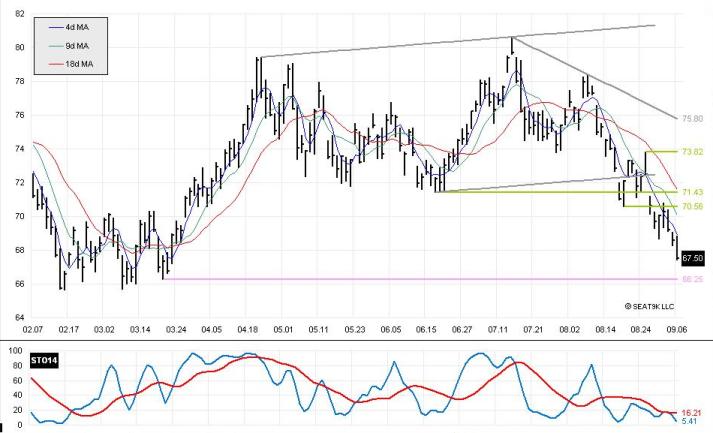
Near-term Opinion: Bearish
Trading accelerated lower on Wednesday, with prices falling over $1/bbl. Although the stochastics remain oversold, we see little price support before 65.65-66.25, especially with the day ending near the bottom of the range. The bears are clearly in control. We would not, however, be surprised to see some profit taking as we get nearer to this strong support level. Our opinion will remain bearish until prices cross the 18-day moving average, which today finished at 71.60. | |||||||||||
| Tuesday 05 September 2006, October Contract, Daily Chart | |||||||||||
 | |||||||||||
| Open | 68.80 |
High | 69.05 |
Low | 68.25 |
Close | 68.60 |
Change | -0.59 |
Percent | -0.9% |
|
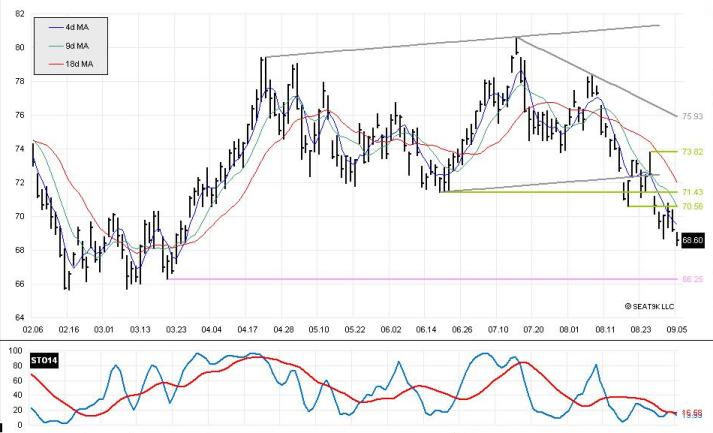
Near-term Opinion: Bearish
Trading moved out of the consolidation zone by opening lower on the day and leaving a small gap on the chart. With little support before the 65.65-66.25 area, we see little concern for the bears pushing prices lower, although the stochastics remain oversold. Our opinion will remain bearish until prices cross the 18-day moving average, which today finished at 72.01. | |||||||||||
| Friday 01 September 2006, Weekly Chart | |||||||||||
 | |||||||||||
| Open | 71.20 |
High | 71.20 |
Low | 68.65 |
Close | 69.19 |
Change | -3.32 |
Percent | -4.6% |
|
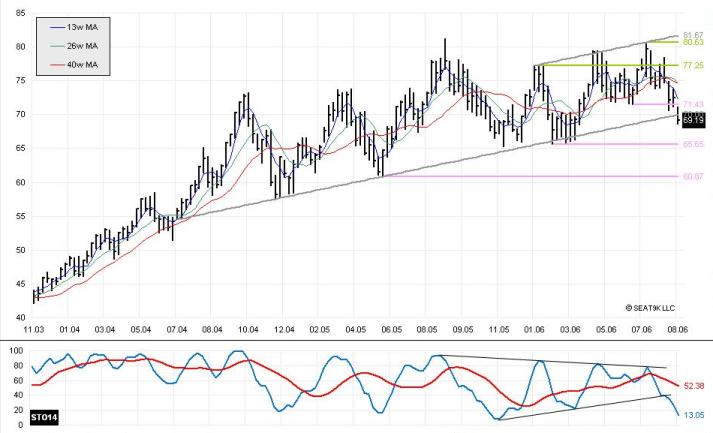
Medium-term Opinion: Bearish
As anticipated, prices fell this week, although we couldn't have anticipated the severity of the weekly drop, with prices sinking over $3/bbl. Things are not looking favorable for the bulls, with prices having passed through the psychological price level of 70.00. We maintain our bearish opinion and see little support before the 65.65 level. However, with the stochastics getting on the oversold side we would not be surprised to see some consolidation. | |||||||||||
| Friday 01 September 2006, October Contract, Daily Chart | |||||||||||
 | |||||||||||
| Open | 70.35 |
High | 70.40 |
Low | 69.10 |
Close | 69.19 |
Change | -1.07 |
Percent | -1.5% |
|
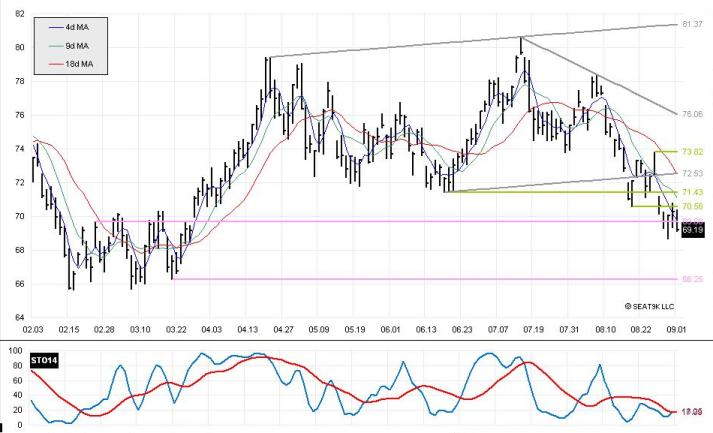
Near-term Opinion: Bearish
The consolidation of trading continued on the abbreviated Friday session. The day's trading range was within the range of the range of the previous two sessions. However, things do not look good for the bulls. Trading failed to stay above the 4-day moving average, and the stochastics have recovered a bit, perhaps enough to allow for another wave lower next week. Today's close was at the bottom of the trading range, and is the lowest close on the chart since the end of March. Our opinion will remain bearish until prices cross the 18-day moving average, which today finished at 72.49. We see little price support before 66.25. | |||||||||||