

| Home | Downloads | About Us | Contact Us | |
| Crude Blog, Main Page |
| Sponsors |
 Ethiopian Airlines Africa's First 787 Arrives in 2008 |
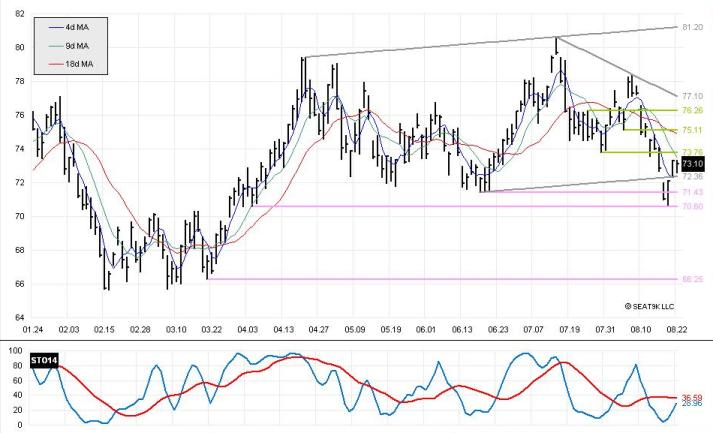
| Thursday 31 August 2006, October Contract, Daily Chart | |||||||||||
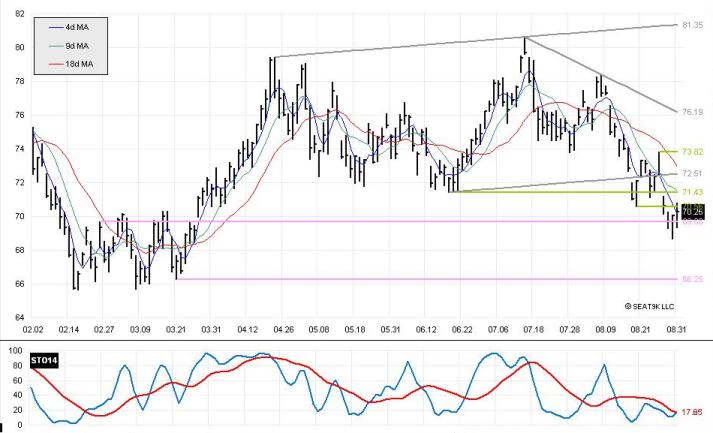 | |||||||||||
| Open | 70.45 |
High | 70.82 |
Low | 69.35 |
Close | 70.26 |
Change | +0.23 |
Percent | +0.3% |
|
Near-term Opinion: Bearish
An unsurprising day in crude oil activity, with a higher range and higher close from the previous session. As indicated in yesterday's report, an outside reversal day such as was witnessed on Wednesday often leads to one or two days reaction in the opposite direction. Although prices failed to get above the relatively weak 70.56 resistance level, Thursday's close was above the 4-day moving average, which is good news for the bulls. However, trading would have to get above the stronger 71.43 resistance level for the bears to be worried. Our opinion will remain bearish until prices cross the 18-day moving average, which today finished at 72.94. | |||||||||||
| Wedneday 30 August 2006, October Contract, Daily Chart | |||||||||||
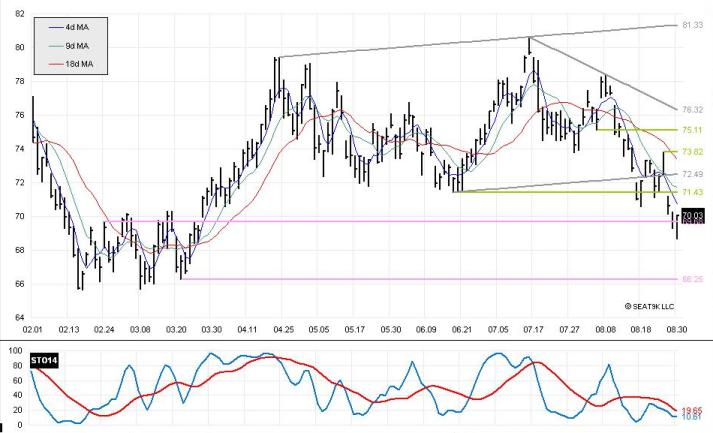 | |||||||||||
| Open | 69.78 |
High | 70.10 |
Low | 68.65 |
Close | 70.03 |
Change | +0.32 |
Percent | +0.5% |
|
Near-term Opinion: Bearish
After dropping lower Wednesday, prices recuperated in the afternoon and by the end of the session prices had closed higher on the day. Today's activity left a potential reversal pattern on the chart, with a new low but closing higher. This often results in at least a one-day continuation of higher prices, which is not surprising considering how oversold the stochastics are. However, the bulls might be able to also capitalize on the fact that the close was at the very top of the day's trading range. We would therefore expect some higher trading over the next few days, although the resistance level of 71.43 should keep prices from accelerating too high. It is our opinion that prices are continuing in a downtrend, but today's activity may likely result in a small wave higher before prices move lower again. Support remains all the way down at 66.25. Our opinion will remain bearish until prices cross the 18-day moving average, which today finished at 73.37. | |||||||||||
| Tuesday 29 August 2006, October Contract, Daily Chart | |||||||||||
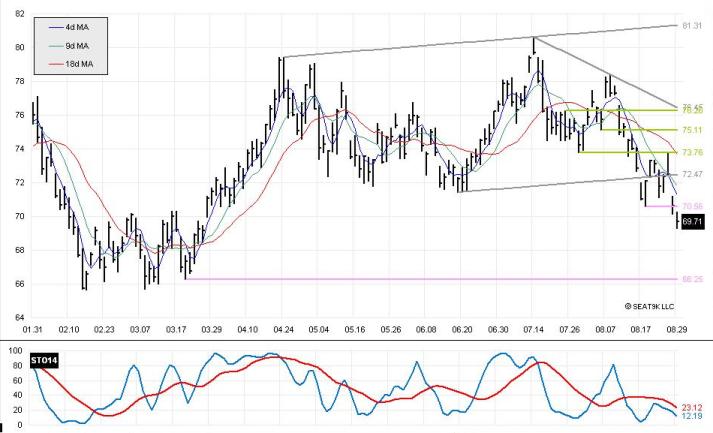 | |||||||||||
| Open | 69.75 |
High | 70.25 |
Low | 69.30 |
Close | 69.71 |
Change | -0.90 |
Percent | -1.3% |
|
Near-term Opinion: Bearish
The bears achieved a goal with today's crude activity, gapping lower on the close and managing to close the day below 70.00, a strong psychological support level. Trading has been very volatile of late, with price gaps all over the chart, but we see little support before 66.25. We would not be surprised, however, if trading consolidated somewhat over the next few session as prices are down almost $3/bbl in just two days. Our opinion will remain bearish until prices cross the 18-day moving average, which today finished at 73.69. | |||||||||||
| Monday 28 August 2006, October Contract, Daily Chart | |||||||||||
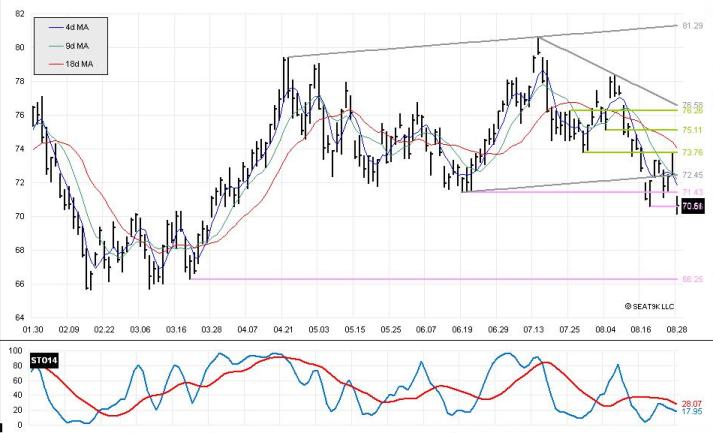 | |||||||||||
| Open | 71.25 |
High | 71.20 |
Low | 70.15 |
Close | 70.61 |
Change | -1.90 |
Percent | -2.62% |
|
Near-term Opinion: Bearish
Crude gapped sharply lower on the opening Monday, a possible reaction from the failure to move higher on Friday. and possibly from the weakly defined flag formation on the chart. Today's close was the lowest in five months. With the failure of the 70.56 level to hold, we would expect prices to continue to trend lower, particularly if the bears can get the close below 70.56. As there is little support before the 66.25 level, things do not look good for the bulls. Our opinion will remain bearish until prices cross the 18-day moving average, which today finished at 74.06. | |||||||||||
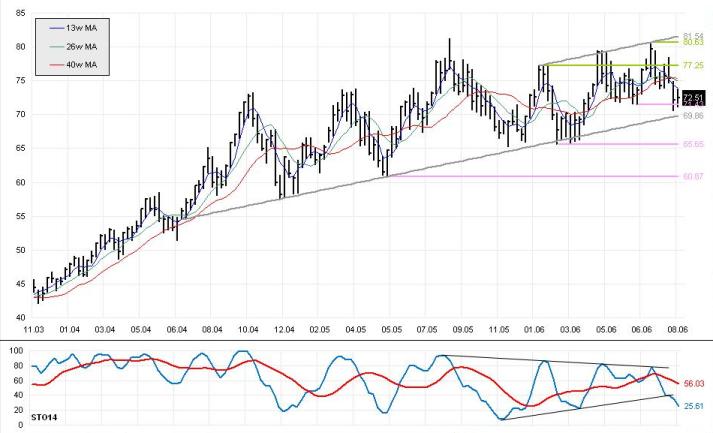
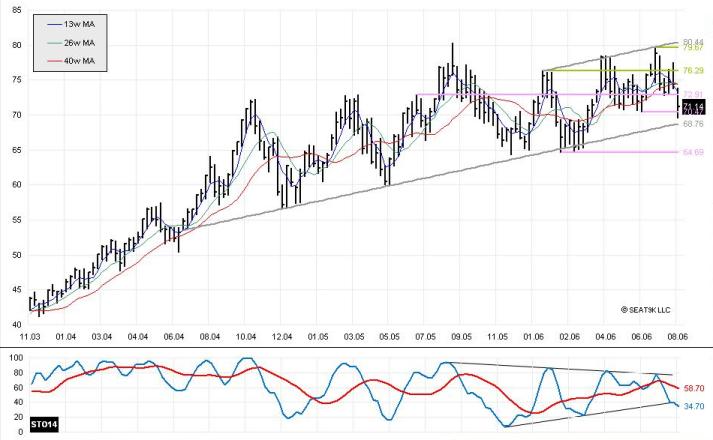
| Friday 25 August 2006, Weekly Chart | |||||||||||
 | |||||||||||
| Open | 72.70 |
High | 73.82 |
Low | 71.10 |
Close | 72.51 |
Change | +0.41 |
Percent | +0.57% |
|
Medium-term Opinion: Bearish
This week's activity resulted in an insider trading pattern, with the week's trading range entirely within the range of the previous week. This simply reflects a pause in trading, and the close higher is basically meaningless. We maintain our bearish opinion based on the breakout of the stochastics on the downside. A close below the support level of 71.43 would be signficant for the bears. | |||||||||||
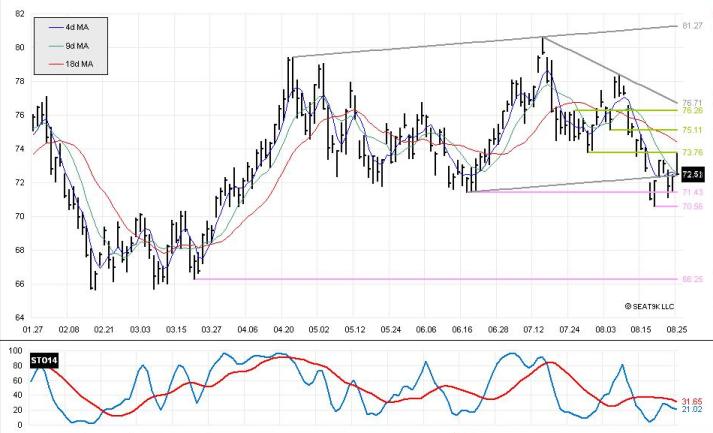
| Friday 25 August 2006, October Contract, Daily Chart | |||||||||||
 | |||||||||||
| Open | 72.80 |
High | 73.82 |
Low | 72.40 |
Close | 72.51 |
Change | +0.15 |
Percent | +0.21% |
|
Near-term Opinion: Bearish
The bulls got off to a strong start on Friday, with prices gapping higher on the opening, but traders could not get above the clearly-defined resistance level of 73.76, and prices fell in the afternoon to close up only slightly. Today's failure to capitalize on the gap higher is good news for the bears, and we may have the beginning of a flag or pennant formation. Our opinion will remain bearish until prices cross the 18-day moving average, which today finished at 74.40. A close below the support level of 70.56 would be significant for the bears. | |||||||||||
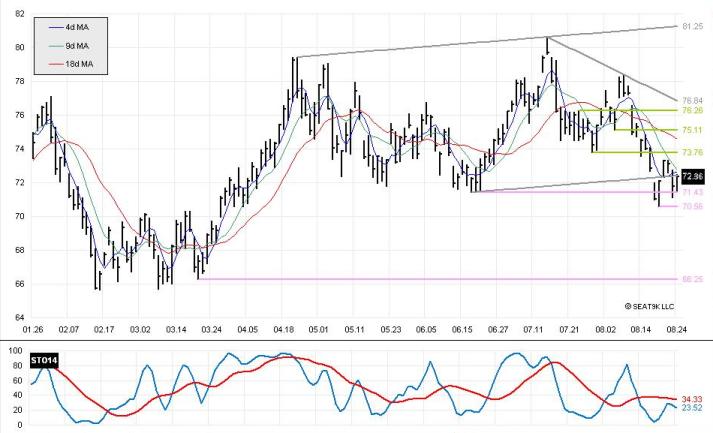
| Thursday 24 August 2006, October Contract, Daily Chart | |||||||||||
 | |||||||||||
| Open | 71.50 |
High | 72.50 |
Low | 71.40 |
Close | 72.36 |
Change | +0.60 |
Percent | +0.84% |
|
Near-term Opinion: Bearish
Thursday's trading activity resulted in an inside trading day, with the high lower than yesterday's high, and today's low higher than yesterday's low. In the grand scheme of things, we consider this day insignificant, although there may be a small flag forming. Our opinion is bearish and will remain so until prices cross above the 18-day moving average, which ended the day at 74.59. | |||||||||||
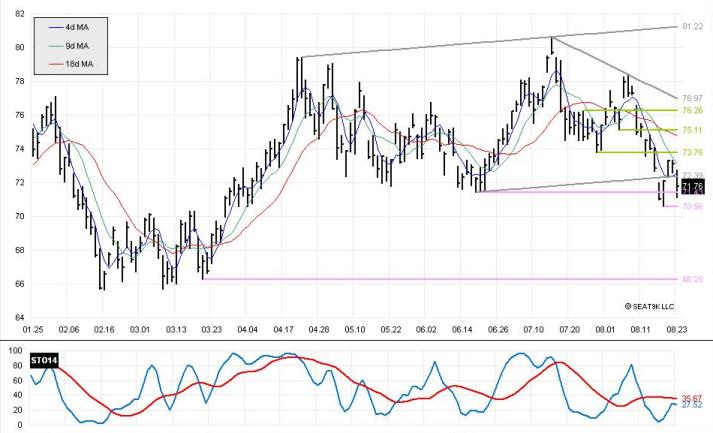
| Wednesday 23 August 2006, October Contract, Daily Chart | |||||||||||
 | |||||||||||
| Open | 72.45 |
High | 72.75 |
Low | 71.10 |
Close | 71.76 |
Change | -1.34 |
Percent | -1.83% |
|
Near-term Opinion: Bearish
Wednesday's crude activity moved sharply lower, with prices down almost 2%. Trading appears to have failed at the 9-day moving average, and sank lower. Our opinion remains bearish, and that the recovery of the stochastics will likely results in a further wave down, although there will be support at the psychological level of 70.00. It should be noted, however, that there is little support between 66.00 and 70.00, which, if prices begin to sink below 70.00, may allow for a more significant drop. Our opinion will remain bearish until prices cross the 18-day moving average, which today finished at 74.75. | |||||||||||
| Tuesday 22 August 2006, October Contract, Daily Chart | |||||||||||
 | |||||||||||
| Open | 73.10 |
High | 73.35 |
Low | 72.60 |
Close | 73.10 |
Change | -0.20 |
Percent | -0.27% |
|
Near-term Opinion: Bearish
Tuesday's activity resulted in an inside trading day, with prices within the bounds of the previous session. Today's close lower is basically meaningless to the trend due to the inside day. The stochastics, however, are recovering to higher levels in this period which may allow prices to sink further on another wave down. Our opinion remains bearish, assuming that prices will witness a relatively small recovery before turning lower again. Our opinion will remain bearish until prices cross the 18-day moving average, which today finished at 74.89. However, there are some issues of concern for the bears, particularly the island gap that was created from the trading activity at the end of last week. | |||||||||||
| Monday 21 August 2006, October Contract, Daily Chart | |||||||||||
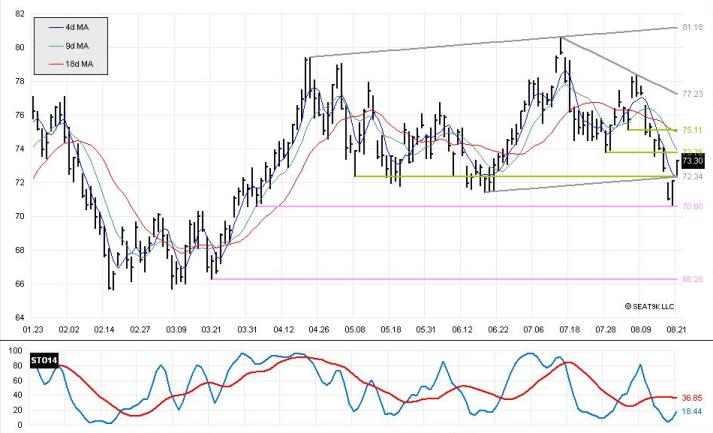 | |||||||||||
| Open | 72.70 |
High | 73.35 |
Low | 72.30 |
Close | 73.30 |
Change | +1.20 |
Percent | +1.66% |
|
Near-term Opinion: Bearish
We have switched contracts to October. October prices rose sharply on Monday, filling the gap left on the chart last week, likely a reaction to the oversold stochastics and the outside reversal day from Friday. Our opinion remains bearish, assuming that prices will witness a relatively small recovery before turning lower again. Our opinion will remain bearish until prices cross the 18-day moving average, which today finished at 75.02. | |||||||||||
| Friday 18 August 2006, Weekly Chart | |||||||||||
 | |||||||||||
| Open | 73.10 |
High | 73.90 |
Low | 69.60 |
Close | 71.14 |
Change | -3.21 |
Percent | -4.32% |
|
Medium-term Opinion Changed: Bearish
Weekly crude fell signifcantly this week, down over $3/bbl. Over the past months, trading has been trending higher, but the stochastics have indicated a narrowing trend, which could not hold over time. This pattern reflected a level of divergence, with signs that the uptrend could not continue due to the corresponding weakness of the stochastics. This week's activity resulted in the penentration of the stochastics pattern. We are therefore changing our opinion to bearish, but would look for penetration of the rising trendline currently at 68.76 as further confirmation of the downtrend. | |||||||||||
| Friday 18 August 2006, September Contract, Daily Chart | |||||||||||
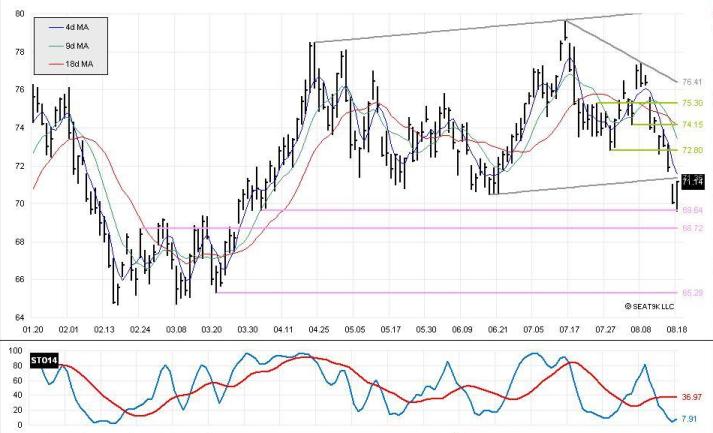 | |||||||||||
| Open | 70.06 |
High | 71.19 |
Low | 69.60 |
Close | 71.14 |
Change | +1.08 |
Percent | +1.54% |
|
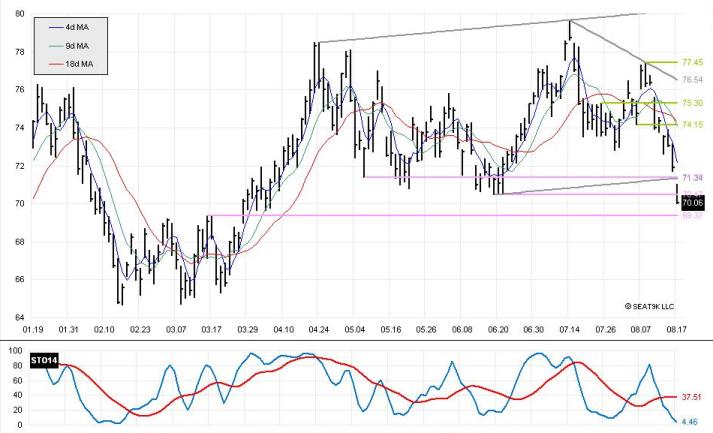
Near-term Opinion: Bearish
September prices recovered on Friday, closing up 1.5%. This reaction was not unexpected, with the sharp movement over past few weeks and the heavily oversold level of the stochastics. The psychological support level of 70.00 likely kept prices from moving further south today as well. We continue to expect prices to move lower, although the next few sessions could see a slight recovery or sideways movement as the stochastics recuperate. Our opinion will remain bearish until prices cross the 18-day moving average, which today finished at 74.15. However, a closure of the gap left on the chart after Thursday's activity should be a warning that the downtrend may fail. | |||||||||||
| Thursday 17 August 2006, September Contract, Daily Chart | |||||||||||
 | |||||||||||
| Open | 70.90 |
High | 71.05 |
Low | 70.00 |
Close | 70.06 |
Change | -1.83 |
Percent | -2.55% |
|
Near-term Opinion Changed: Bearish
September Crude oil futures dropped $1.83 today, over 2.5%, creating a gap in the chart. Unlike the gap created on 14 July which ended the day in the opposite direction of the trend and eventually resulted in a reversal gap, today's activity ended in the direction of the trend. Despite the oversold position of the stochastics, there is a likelihood that today's activity will be seen as a runaway gap, indicating an acceleration in the current trend. As long as the gap resulting from today's activity is not filled over the next few sessions, the runaway gap will be confirmed. Runaway gaps often constitute the mid-point of a trend. Thus, if the gap holds, we could expect the current downtrend that started with the reversal day on 09 August to move down $6.00 further, down to about $65.50. With the failure of the 70.47 level to support prices, we are changing our opinion to bearish. Although there is some support at 69.37, the next strong support level is at 64.70. However, with the oversold situation, we would not be surprised to prices move sideways or slightly higher over the next few sessions, especially considering that the psychological level of 70.00 held today. Our opinion will remain bearish until prices cross the 18-day moving average, which today finished at 74.30. | |||||||||||
| Wednesday 16 August 2006, September Contract, Daily Chart | |||||||||||
 | |||||||||||
| Open | 72.75 |
High | 73.15 |
Low | 71.70 |
Close | 71.89 |
Change | -1.16 |
Percent | -1.59% |
|
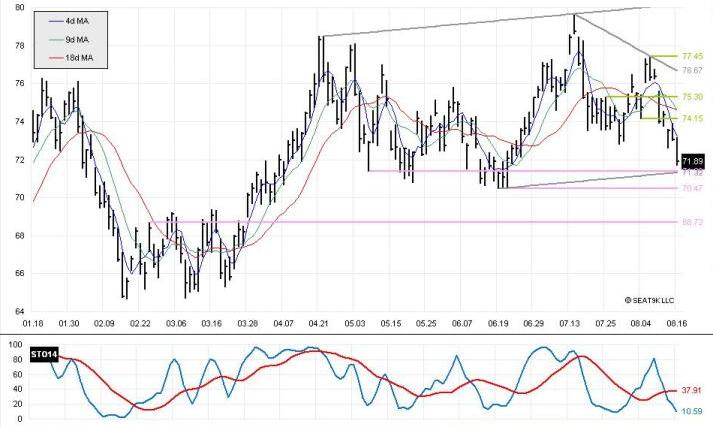
Near-term Opinion: Neutral, edge to bullish
September Crude oil futures dropped over $1/bbl today, breaking through the relatively strong support level of 72.80, the recent July low. Today's activity is a likely reaction from yesterday's reversal day and failure at the 4-day moving average. Based on the prominant island gap from 14 July and the recent failing at the moving averages, one should expect a further fall in prices. There are two support levels to watch. The 71.32 level represents the rising lower boundary of the broad trend channel. This support is relatively weak. A stronger support level remains at 70.47, the lowest price seen since April. Although the stochastics are oversold, we would expect prices to gravitate towards the support level of 70.47, even if achieving this level requires another wave of activity.Should prices break the 70.47 barrier, our opinion on crude oil prices would change from NEUTRAL to BEARISH. |
|||||||||||